Just before the new year the JSConf EU Call for Speakers ended, and we’re overwhelmed by the sheer number and quality of the submissions! We’re currently sifting through a record 928 talk proposals and want to thank all of you who have participated!
Our review process starts with an anonymized stage in which our review panel grades every submission based on the title and description of the talk only. While we have evolved the process since 2012, you can read about it in more detail here.
However, we collect some additional demographic information and thought it may be helpful to share the data with the rest of the community to give insights into the population of potential speakers for tech conferences in 2019.
Please note, that all this data is self reported and is based on free form text fields rather than a fixed set of options. For better comprehensibility we have manually edited some of the data (Such as aligning case “women” -> “Women” or singular/plural “Woman” -> “Women”).
Please note, that these data points represented the unreviewed submission data. Our observation from previous years is that proposals from underrepresented people in tech tend to skew higher in review score, so the distribution for speakers will likely look quite different.
Unless otherwise noted the “Percent” data represents the percent of unique submitters (as measured by unique email addresses) while the count represents the raw count of submissions (one person may submit multiple talks).
Gender Distribution
| Gender | Percent | Count |
|---|---|---|
| Male | 72.47% | 643 |
| Female | 19.52% | 177 |
| Not stated | 6.35% | 85 |
| Male/Female (2 speakers) | 0.76% | 8 |
| Non-binary | 0.76% | 6 |
| Non-binary woman | 0.45% | 3 |
| Gender-nonconforming male | 0.15% | 2 |
| They/Them | 0.15% | 1 |
| Female and Male panelists | 0.15% | 1 |
| Female / Transgender Woman | 0.15% | 1 |
| Demiboy | 0.15% | 1 |
| Grand Total | 100.00% | 928 |
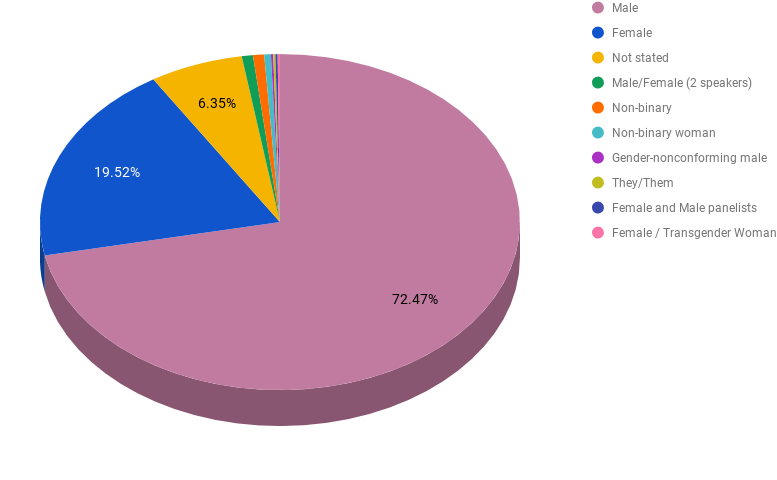
While we are clearly far away from a gender representation in our talk submission pool that would reflect the world outside of tech, we are beyond excited about the absolute numbers — with the count of non-male speaker candidates widely exceeding the total number of submissions we had just a few years ago.
Underrepresented Groups in Tech
| I’m a member of this underrepresented group in tech | Percent | Count |
|---|---|---|
| 62.78% | 572 | |
| No | 7.87% | 75 |
| Women in Tech | 7.41% | 66 |
| Yes | 3.48% | 31 |
| Person of Color | 3.48% | 35 |
| Hispanic or Latino | 2.42% | 20 |
| Women of Color | 1.51% | 15 |
| LGBTQ+ | 0.91% | 12 |
| Latinx Women | 0.76% | 6 |
| Gay | 0.45% | 5 |
| Asian | 0.45% | 4 |
| South Asian | 0.30% | 6 |
| Youth/Pupils | 0.15% | 5 |
| Young academic, Israeli | 0.15% | 2 |
| YES. Beautifully black community! | 0.15% | 1 |
| Yes, I’m transgender. | 0.15% | 1 |
| yes (see gender above) | 0.15% | 1 |
| Yes (African American) | 0.15% | 1 |
| Yes - Latina woman | 0.15% | 1 |
| Yes - I’m trans | 0.15% | 1 |
| Working in a non-profit organisation for children with learning disabilities | 0.15% | 1 |
| Women, people with disabilities | 0.15% | 1 |
| women, mothers, Jews | 0.15% | 1 |
| Women, latino, LGBT | 0.15% | 1 |
| Women Who Code, Women in Tech | 0.15% | 1 |
| women over 50 | 0.15% | 1 |
| Women of Colour, Bisexual | 0.15% | 1 |
| Woman. 50 (shhhhhh) | 0.15% | 1 |
| Woman, Transgender Woman, Jewish | 0.15% | 1 |
| Woman, non-white, Gen-X | 0.15% | 1 |
| Woman, Hispanic, LGBTQ | 0.15% | 3 |
| Woman of color, Bisexual | 0.15% | 1 |
| Visually impaired | 0.15% | 1 |
| trans woman, nonbinary, queer, pansexual | 0.15% | 1 |
| Queer, Southeast Asian, mentally ill | 0.15% | 1 |
| queer, nonbinary, invisible disabilities | 0.15% | 1 |
| Queer, gay, Bengali | 0.15% | 1 |
| Person of color and African origin | 0.15% | 1 |
| Old people over 40 | 0.15% | 1 |
| nonbinary, queer, invisible disability | 0.15% | 1 |
| non-binary, woman | 0.15% | 1 |
| non-binary, queer, transmasculine | 0.15% | 1 |
| Native American/latino | 0.15% | 1 |
| mother, Jewish, woman | 0.15% | 1 |
| mother, Jew, woman | 0.15% | 1 |
| Minority (biracial - latino/middle eastern) | 0.15% | 1 |
| lgbtqia | 0.15% | 1 |
| LGBTQA | 0.15% | 1 |
| lgbtq, latinx, ESL, not-men | 0.15% | 1 |
| LGBTQ, Latinx | 0.15% | 1 |
| LGBTIAQ, disabled, non-binary | 0.15% | 1 |
| LGBT+ and Women in Tech | 0.15% | 1 |
| LGBT, Queer, South Asian | 0.15% | 1 |
| LGBT by being gay? But not sure this response fit the question. | 0.15% | 1 |
| LGBT | 0.15% | 1 |
| Lesbian, Black (African-American), Cis-Female | 0.15% | 1 |
| Lesbian | 0.15% | 1 |
| ladies? moms? over-40s? | 0.15% | 1 |
| is south american, living in south america an underrepresented group? not sure | 0.15% | 1 |
| International brown student | 0.15% | 1 |
| In the country I’m living in, I am a racial and gender minority in tech | 0.15% | 1 |
| I’m over 40 so… kinda! ;P | 0.15% | 1 |
| I’m in a racial minority in the country I am living in, also a gender minority | 0.15% | 1 |
| I’m gay, but I don’t know if that counts as underrepresented | 0.15% | 1 |
| I’m from Low income country and less amount to tech events to participate | 0.15% | 1 |
| I identify as queer | 0.15% | 1 |
| I am a parent of two African American children so this is important to me, but I am personally not a member of an underrepresented group. | 0.15% | 1 |
| I am a musician by training, having a degree in classical composition. As a self-taught learner, I believe I bring a unique perspective as a speaker. | 0.15% | 1 |
| Financially underrepresented | 0.15% | 1 |
| Female, LGBT | 0.15% | 1 |
| Female, LBGT | 0.15% | 1 |
| Female, disabled | 0.15% | 1 |
| Female tech entrepeneurs | 0.15% | 1 |
| Female over 60 | 0.15% | 1 |
| Female + LGBT | 0.15% | 1 |
| Female & LGBTQ+ | 0.15% | 1 |
| Eastern Europe (not sure if underrepresented) | 0.15% | 1 |
| East Asian woman | 0.15% | 1 |
| Demiboys | 0.15% | 1 |
| Deaf | 0.15% | 1 |
| Caribbean Developer | 0.15% | 1 |
| Black, queer (lesbian) | 0.15% | 1 |
| bi-sexual woman | 0.15% | 1 |
| Asian/Filipino | 0.15% | 1 |
| Asian; Women | 0.15% | 1 |
| Armenian | 0.15% | 1 |
| Grand Total | 100.00% | 928 |
Country of Origin
| Country | Percent | Count |
|---|---|---|
| United States | 29.65% | 291 |
| Germany | 11.50% | 107 |
| India | 7.26% | 58 |
| United Kingdom | 6.51% | 47 |
| Australia | 3.78% | 41 |
| Canada | 2.72% | 40 |
| Spain | 2.12% | 31 |
| Netherlands | 3.33% | 31 |
| Israel | 3.03% | 26 |
| France | 2.87% | 23 |
| Norway | 1.82% | 19 |
| Poland | 1.66% | 18 |
| Brazil | 1.82% | 16 |
| Nigeria | 1.82% | 15 |
| Argentina | 1.36% | 13 |
| Sweden | 1.36% | 10 |
| Czech Republic | 0.61% | 10 |
| Austria | 0.91% | 10 |
| Ukraine | 1.36% | 9 |
| Colombia | 0.91% | 9 |
| Ireland | 1.06% | 7 |
| Russia | 0.91% | 6 |
| Belgium | 0.76% | 6 |
| México | 0.76% | 5 |
| Italy | 0.45% | 5 |
| Serbia | 0.61% | 4 |
| Romania | 0.61% | 4 |
| Portugal | 0.45% | 4 |
| Finland | 0.61% | 4 |
| Bulgaria | 0.45% | 4 |
| Quebec, Canada | 0.15% | 3 |
| Perú | 0.45% | 3 |
| Japan | 0.45% | 3 |
| Hungary | 0.30% | 3 |
| Greece | 0.30% | 3 |
| England | 0.45% | 3 |
| Denmark | 0.45% | 3 |
| Croatia | 0.15% | 3 |
| Switzerland | 0.15% | 2 |
| South Africa | 0.30% | 2 |
| Lithuania | 0.30% | 2 |
| Italy / Belgium | 0.15% | 2 |
| China | 0.30% | 2 |
| Tunisia | 0.15% | 1 |
| Trinidad and Tobago | 0.15% | 1 |
| Tanzania | 0.15% | 1 |
| Taiwan | 0.15% | 1 |
| Sri Lanka | 0.15% | 1 |
| Slovenia | 0.15% | 1 |
| Singapore | 0.15% | 1 |
| Scotland | 0.15% | 1 |
| Polska | 0.15% | 1 |
| Philippines | 0.15% | 1 |
| Nepal | 0.15% | 1 |
| Malaysia | 0.15% | 1 |
| Japan/Taiwan | 0.15% | 1 |
| Italia | 0.15% | 1 |
| Hong Kong | 0.15% | 1 |
| Egypt | 0.15% | 1 |
| Britain | 0.15% | 1 |
| Brasil | 0.15% | 1 |
| Belarus | 0.15% | 1 |
| Bangladesh | 0.15% | 1 |
| 0.15% | 1 | |
| Grand Total | 100.00% | 928 |
The plurality of submissions for a conference in Berlin, Germany is coming from the USA — clearly showing the uneven distribution of tech between Europe and the US. India coming out on top of all European countries except Germany represents a new trend for our event.
We are proud however, of the overall number of different countries represented, as we’re hoping to provide as good of a global perspective on JavaScript as we possibly can.
Employer (Top 25)
| Employer | Percent | Count |
|---|---|---|
| n/a | 10.89% | 99 |
| IBM | 2.72% | 30 |
| 1.82% | 14 | |
| Microsoft | 1.21% | 12 |
| Wix | 1.06% | 9 |
| 0.91% | 8 | |
| Auth0 | 0.76% | 10 |
| Slack | 0.61% | 5 |
| Mozilla | 0.61% | 4 |
| Freelance | 0.61% | 5 |
| Confrere | 0.61% | 6 |
| Atlassian | 0.61% | 5 |
| Zenika | 0.45% | 3 |
| ThoughtWorks | 0.45% | 7 |
| Readify | 0.45% | 7 |
| Rangle.io | 0.45% | 6 |
| Progress | 0.45% | 3 |
| PayPal | 0.45% | 4 |
| Netflix | 0.45% | 5 |
| NearForm | 0.45% | 3 |
| Mapbox | 0.45% | 3 |
| GitHub | 0.45% | 6 |
| Eventbrite | 0.45% | 9 |
| American Express | 0.45% | 5 |
| Zillow | 0.30% | 2 |
After years of Google coming out on top of the company representation in our submission pool, IBM made a surprise appearance with more than twice as many submissions as Google.
Summary
We hope this data is helpful in setting a baseline as to what can be expected in terms of distribution of speakers along various axes. Especially we want to note that the scale of the JavaScript community is now such that absolute numbers easily allow for equal representation of underrepresented groups in tech within smaller groups such as the “selected speakers at an event”.
Excuses such as “There are no women speakers” are now proven to be invalid (they never were valid in the first place). However, events shouldn’t expect similar numbers if they don’t invest in encouraging speakers from underrepresented groups to submit talks to their events. We realize this is extra work beyond just opening a call for speakers with open submissions, but we believe it is absolutely essential for running a technology event today.